One of the most consequential misunderstandings in academic science is the conflation of research quality with research metrics. Citation counts, h-indices, and journal impact factors are quantitative, easy to compare, and superficially objective — properties that make them enormously attractive for administrative purposes and deeply problematic for scientific purposes. Understanding what research metrics measure, what they fail to capture, and how they should be interpreted requires both statistical literacy and familiarity with the critiques that have accumulated over decades of scholarship on the sociology of science. This chapter examines the major tools for tracking and evaluating research impact, from traditional citation metrics to emerging altmetrics, and describes the principles that should guide their responsible use.
What Is Research Impact? Beyond Citation Counts
Research impact is a genuinely multidimensional concept that resists reduction to any single number. At its most fundamental, a piece of research has impact when it changes something: when it alters how other scientists think about a problem, when it enables a new technology or clinical practice, when it informs policy, when it shapes public understanding of a natural phenomenon. These different modes of impact operate on different timescales and in different social systems, and they cannot all be captured by counting how many other papers cite a given article.
Citation counts measure one dimension of scientific impact: the degree to which a piece of work has been referenced in subsequent scientific literature. This is a meaningful signal, but it is noisy, context-dependent, and subject to numerous distortions. A paper can be heavily cited because it reports a landmark finding, but also because it described a widely used reagent or cell line, because it contained an error that prompted extensive commentary, or because it was the first paper to appear in a new subfield and was subsequently cited by every paper in that subfield for historical completeness. Conversely, an important paper can be undercited because it was published in a lower-profile venue, because its findings were difficult to replicate and therefore rarely built upon, or simply because it was ahead of its time Ioannidis, J. P. A. (2005). Why most published research findings are false. PLoS Medicine, 2(8), e124. https://doi.org/10.1371/journal.pmed.0020124.
The time dimension of citation accumulation is also important. Papers in experimental biology often have a citation half-life of five to ten years — their citation rate peaks several years after publication and then declines as the work is absorbed into the field’s background knowledge. Papers in mathematics or theoretical physics may accumulate citations over much longer timescales. Comparing citation counts for papers published in different years, or in different disciplines, without accounting for these dynamics produces misleading comparisons.
Citation Metrics: h-Index, i10-Index, and Total Citations
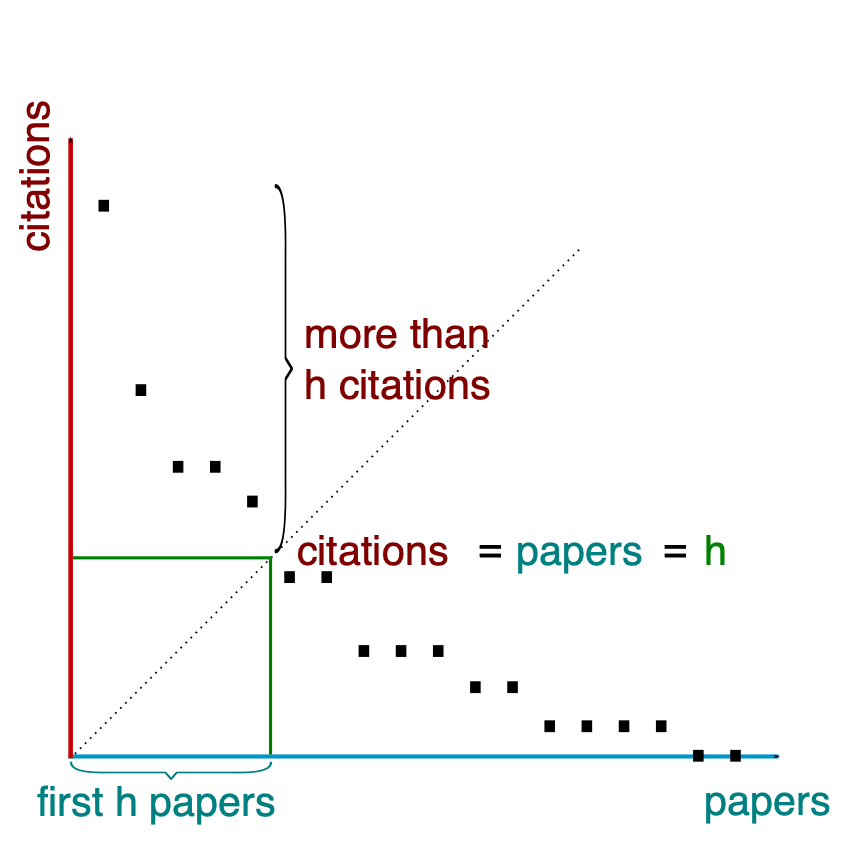
The h-index, proposed by physicist Jorge Hirsch in 2005, is defined as the largest number h such that h papers by a given author have each been cited at least h times Hirsch, J. E. (2005). An index to quantify an individual’s scientific research output. Proceedings of the National Academy of Sciences, 102(46), 16569–16572. https://doi.org/10.1073/pnas.0507655102. A researcher with an h-index of 20 has published at least 20 papers that each have at least 20 citations. The h-index was designed to provide a single number that reflects both productivity (the number of papers) and impact (the number of citations per paper), avoiding the distortion of a single highly cited paper inflating a researcher’s apparent productivity.
Despite its widespread adoption, the h-index has significant limitations. It increases monotonically over time, meaning that a researcher who publishes at a constant rate with consistent impact will accumulate a higher h-index simply by virtue of having been active for longer. This makes the h-index a poor tool for comparing researchers at different career stages, even within the same field. It also fails to distinguish between a researcher who has published many modestly cited papers and one who has published a smaller number of highly cited ones; both could have the same h-index. It cannot be directly compared across disciplines, because average citation rates differ dramatically between fields — a biologist and a computer scientist with the same h-index may occupy very different positions within their respective fields.
The i10-index, used by Google Scholar, counts the number of publications with at least 10 citations. It is a simpler and more transparent metric than the h-index, but it shares many of the same limitations: it is time-dependent, field-dependent, and insensitive to the distribution of citations across a researcher’s body of work. Total citation count — the sum of all citations to all publications by an author — is the most transparent of all citation metrics but is the most susceptible to distortion by a small number of highly cited outlier papers.
All of these author-level metrics should be treated as rough indicators rather than precise measurements. When used in evaluation contexts — hiring, promotion, grant review — they provide one data point among many and should be interpreted by people who understand the norms of the specific field and career stage in question. The practices of normalizing for field, career age, and the number of co-authors on each publication substantially improve the fairness of citation-based evaluations but are inconsistently applied in practice Hicks, D., Wouters, P., Waltman, L., De Rijcke, S., & Rafols, I. (2015). Bibliometrics: The Leiden Manifesto for research metrics. Nature, 520(7548), 429–431. https://doi.org/10.1038/520429a.
Journal-Level, Article-Level, and Author-Level Metrics
A critical distinction in the metrics landscape is the difference between journal-level, article-level, and author-level indicators. Journal-level metrics — most prominently the Journal Impact Factor — describe the average citation behavior of a journal’s entire portfolio. They say nothing about any individual article or any individual author. Using a journal-level metric to evaluate an individual researcher’s contribution conflates the quality of the venue with the quality of the specific work, a logical error that has been extensively documented and criticized American Society for Cell Biology. (2013). San Francisco Declaration on Research Assessment (DORA). https://sfdora.org/read/.
Article-level metrics, in contrast, describe the reception and use of a specific paper. Total citations, downloads, HTML views, and social media shares are all article-level metrics. They have the advantage of being directly relevant to the paper in question rather than serving as proxy measures, but they are still subject to the same time-dependence and field-normalization issues that affect other citation metrics. A paper published six months ago will have fewer citations than a paper published six years ago regardless of relative quality.
Author-level metrics aggregate across all of a researcher’s publications to characterize their overall scholarly output. The h-index, i10-index, and total citation count are the most common examples. Author-level metrics are the most directly relevant to evaluating an individual researcher, but they inherit all of the limitations of the underlying citation data and add further complexity when the researcher has published across multiple subfields, changed institutional affiliations, or contributed to papers with very large author lists (as is common in genomics, clinical trials, and high-energy physics) Ioannidis, J. P. A. (2005). Why most published research findings are false. PLoS Medicine, 2(8), e124. https://doi.org/10.1371/journal.pmed.0020124.
Altmetrics: Measuring Broader Engagement
Altmetrics — a portmanteau of “alternative metrics” — refers to a suite of indicators that track scholarly activity beyond traditional citation counts, including news media coverage, policy document citations, social media mentions, Wikipedia citations, blog posts, and online reader bookmarks Priem, J., Taraborelli, D., Groth, P., & Neylon, C. (2010). Altmetrics: A manifesto. http://altmetrics.org/manifesto/. The term was coined around 2010 in response to a growing recognition that journal articles influence society through channels that bibliometric databases do not capture.
Altmetric Attention Scores, calculated by the company Altmetric (altmetric.com), aggregate mentions of a paper across multiple platforms and media types into a single number displayed on a colorful donut chart. A high Altmetric score indicates that a paper has attracted substantial attention online; it does not necessarily indicate scientific quality or long-term influence. Papers that are controversial, topically newsworthy, or easily summarized for a general audience may attract high Altmetric scores while having modest scientific impact in terms of citations from primary researchers. Conversely, methodologically important papers that transform how experiments are done may be heavily cited by specialists but attract minimal public attention.
The value of altmetrics lies in what they reveal that traditional bibliometrics cannot: the degree to which a piece of research has entered public discourse, informed policy, or generated popular engagement. For researchers who care about the societal relevance of their work, tracking altmetrics provides a richer picture of impact than citation counts alone. Policymakers and advocacy organizations increasingly value evidence that research findings have influenced non-scientific discourse, and altmetric evidence can be useful when making the case for the societal value of a research program in grant applications or public communications.
Tracking Your Own Impact
Several platforms provide tools for tracking and aggregating your personal citation metrics. Google Scholar, as described in the previous chapter, provides the most accessible overview, including h-index, i10-index, total citations, and a year-by-year citation history for your profile. Web of Science’s ResearcherID allows you to create a verified profile linked to your publications in the Web of Science database, which indexes a curated set of high-quality journals and provides citation statistics normalized against Web of Science coverage. Scopus Author ID, maintained by Elsevier, provides similar functionality for the Scopus database, which has broader coverage than Web of Science in some fields, including social sciences and humanities.
Setting up profiles on these platforms and periodically reviewing their accuracy — adding missing publications, removing misattributed ones — ensures that your citation record is accessible and correct. Discrepancies between platforms are common because the three major databases index overlapping but non-identical sets of publications; a paper published in a journal indexed by Scopus but not Web of Science will appear in one database’s citation statistics but not the other’s. Using multiple platforms and noting discrepancies in any reporting you do ensures that you present your metrics in context.
For grant applications and promotion dossiers that require citation data, it is good practice to specify which database and date range were used to generate the reported figures, since the same researcher’s statistics can vary substantially between databases and over time. Some funders and institutions now ask applicants to use specific databases for their citation data, which simplifies comparison across applicants.
Responsible Metrics: DORA and the Leiden Manifesto
Two frameworks have emerged as important reference points for responsible use of research metrics in evaluation contexts. The San Francisco Declaration on Research Assessment (DORA), launched in 2013 by the American Society for Cell Biology, calls on funding agencies, institutions, publishers, and researchers to commit to not using journal-based metrics (primarily the Journal Impact Factor) as a surrogate measure of the quality of individual research articles in funding, appointment, and promotion decisions American Society for Cell Biology. (2013). San Francisco Declaration on Research Assessment (DORA). https://sfdora.org/read/. DORA does not oppose the use of citation metrics per se, but insists that journal-level metrics should not be applied to individual-level evaluation.
The Leiden Manifesto, published in 2015 by a group of scientometrics experts, articulates ten principles for responsible metrics use Hicks, D., Wouters, P., Waltman, L., De Rijcke, S., & Rafols, I. (2015). Bibliometrics: The Leiden Manifesto for research metrics. Nature, 520(7548), 429–431. https://doi.org/10.1038/520429a. These include: quantitative evaluation should support, not substitute for, qualitative expert judgment; measurement should be tailored to the specific research context; those being evaluated should be able to verify the data and methodology used; and the importance of local, context-specific norms should be recognized. The Leiden Manifesto acknowledges that metrics provide valuable information when used thoughtfully while warning against the tendency to oversimplify complex research contributions into a small set of numbers.
Both DORA and the Leiden Manifesto have been endorsed by thousands of researchers, institutions, and funders worldwide. If you are in a position where metrics are used to evaluate your work — grant applications, job applications, promotion reviews — familiarizing yourself with these frameworks and the arguments they make enables you to provide context for your metrics, advocate for fair evaluation, and understand the institutional commitments of the organizations assessing you.
Translational and Societal Impact
Citation metrics, whether traditional or altmetric, primarily track impact within the academic literature and the online discourse that surrounds it. An increasingly important dimension of research impact — particularly for biomedical research with clinical or public health applications — is translational impact: the degree to which findings have influenced clinical guidelines, regulatory decisions, patent applications, or health policy.
Patent citations to research publications are tracked by databases such as Lens.org and can be used to identify when a piece of basic science has contributed to a downstream technological development. Clinical guideline citations — when a paper is cited in evidence-based clinical practice guidelines from organizations such as the US Preventive Services Task Force, the American Heart Association, or the World Health Organization — are arguably among the strongest indicators of translational impact in the biomedical sciences, because they represent expert consensus that a finding is robust enough to guide medical practice. The NIH iCite tool, which calculates a Relative Citation Ratio (RCR) normalizing citations by field and year, also provides information on whether a paper has been cited in clinical contexts.
Broader societal impact — contributions to public understanding, science education, policy advocacy, or community engagement — is difficult to quantify but genuinely important. Science communication activities, public lectures, media appearances, educational resource development, and engagement with policymakers all represent modes of impact that traditional metrics do not capture. Building a portfolio of evidence for societal impact, including documenting specific policy changes influenced by your research or specific educational uses of your materials, provides a fuller account of your work’s value than any single metric can offer.
Research impact is ultimately what your work does in the world — how it changes what scientists know, what clinicians practice, what policymakers decide, and what the public understands. Metrics are imperfect tools for measuring these effects, and their limitations must be understood by anyone who uses them. The goal is not to abandon quantitative indicators but to use them critically, in combination with qualitative assessment, and with a clear awareness of what each indicator does and does not tell us.
Bibliography
- American Society for Cell Biology. (2013). San Francisco Declaration on Research Assessment (DORA). https://sfdora.org/read/
- Hicks, D., Wouters, P., Waltman, L., De Rijcke, S., & Rafols, I. (2015). Bibliometrics: The Leiden Manifesto for research metrics. Nature, 520(7548), 429–431. https://doi.org/10.1038/520429a
- Hirsch, J. E. (2005). An index to quantify an individual’s scientific research output. Proceedings of the National Academy of Sciences, 102(46), 16569–16572. https://doi.org/10.1073/pnas.0507655102
- Ioannidis, J. P. A. (2005). Why most published research findings are false. PLoS Medicine, 2(8), e124. https://doi.org/10.1371/journal.pmed.0020124
- Priem, J., Taraborelli, D., Groth, P., & Neylon, C. (2010). Altmetrics: A manifesto. http://altmetrics.org/manifesto/